Study: States with larger Black populations tend to have more Flock cameras
Cybernews investigates which demographic and economic factors influence the prevalence of Flock cameras in US states and counties.

 Follow us
- At the state level, the share of the Black population was the only demographic variable significantly associated with Flock camera density.
- At the county level, higher shares of Hispanic/Latino and Native American populations were significantly associated with higher camera density.
- Also at the county level, each percentage-point decrease in the poverty rate was associated with roughly a 4.3% increase in cameras per capita.
There are now almost 3 times more Flock cameras in the US than there are Walmart, McDonald's, Starbucks, and Dunkin' locations combined.
The number of Flock cameras is roughly equivalent to the number of K-12 schools nationwide.
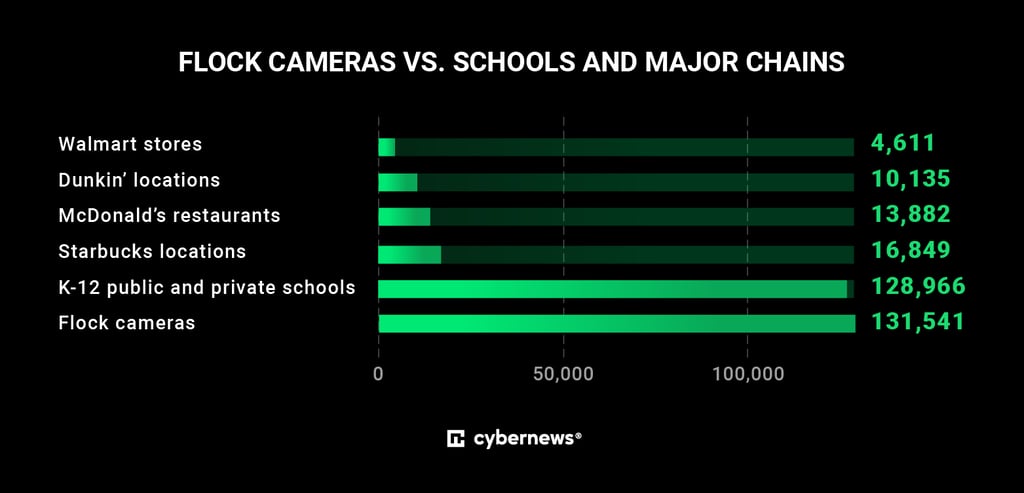
And because Flock camera count comes from a crowdsourced public map deFlock.org, the real number of Flock cameras is almost certainly higher.



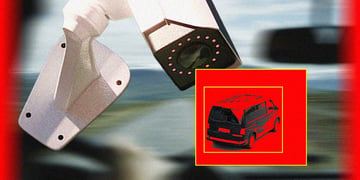
In this report, the Cybernews research team looked at whether or not demographic and economic factors like race and income correlate with Flock camera density in US states and counties.
Two statistical methods applied
We used two different statistical methods to examine the relationship between Flock camera density and demographic and economic factors.
First, we used Pearson’s correlation. This measures whether two variables tend to move together. For example, whether states with a higher share of Black residents also tend to have more Flock cameras per resident. These are simple, one-variable-at-a-time relationships and do not account for other factors.
Second, we used multivariate regression to compare counties within the same state while controlling for multiple factors at once, including population density, income, poverty, and demographic variables. This helps account for differences between states and shows whether a relationship remains after other factors are held constant.
These two approaches answer different questions, so a relationship found in the state-level correlation analysis does not necessarily appear in the county-level regression.
State-level Pearson’s correlations: only Black population matters
Comparing state-by-state, the share of residents who are Black was the only demographic variable in the analysis with a statistically significant relationship to camera density. States with higher Black population shares tended to have more cameras per person.
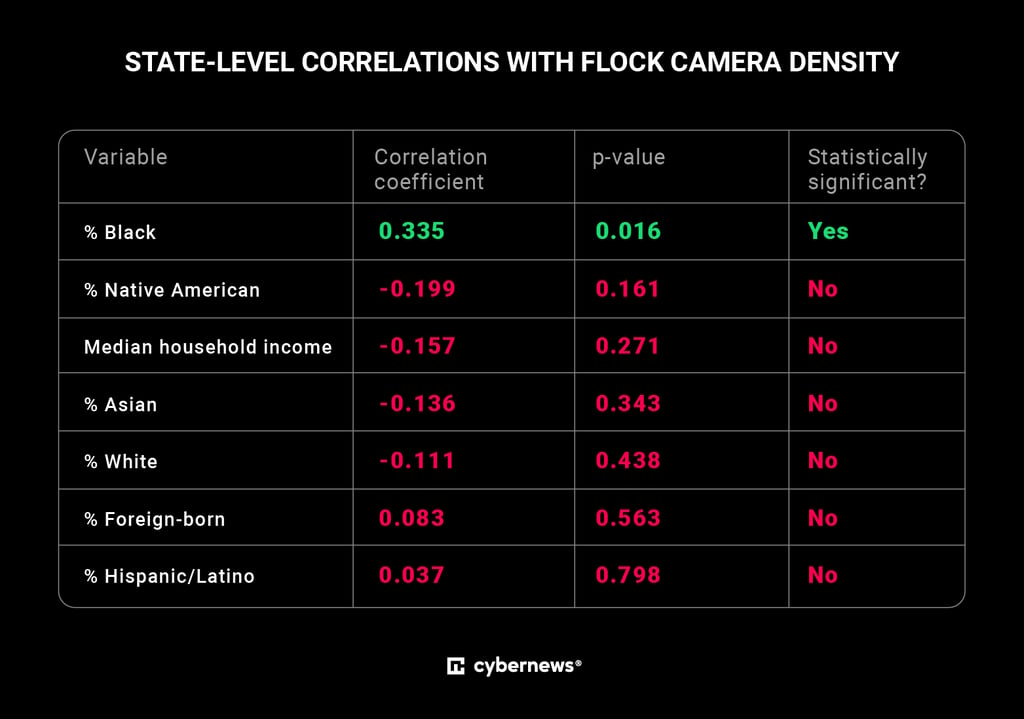
However, the correlation coefficient is rather modest at 0.34, and in no way does our study imply causation
It’s important to note that this is a between-state pattern, not evidence that counties or neighborhoods with more black residents are targeted.
Once counties were compared against other counties in the same state, the relationship between black population and camera density was no longer statistically significant.
If a surveillance network this large was ever compromised, the consequences could be catastrophic,says Voldemaras Kadys, Head of Security and Platform Engineering at Mediatech.
County-level multivariate regression: Hispanic and Native American shares linked to higher camera density
Using multivariate regression, we found three statistically significant relationships.
Within the same state, counties with a larger Hispanic/Latino population share and counties with a larger Native American population share tended to have more mapped cameras per resident, even after accounting for population density, income, poverty, and other demographic factors.
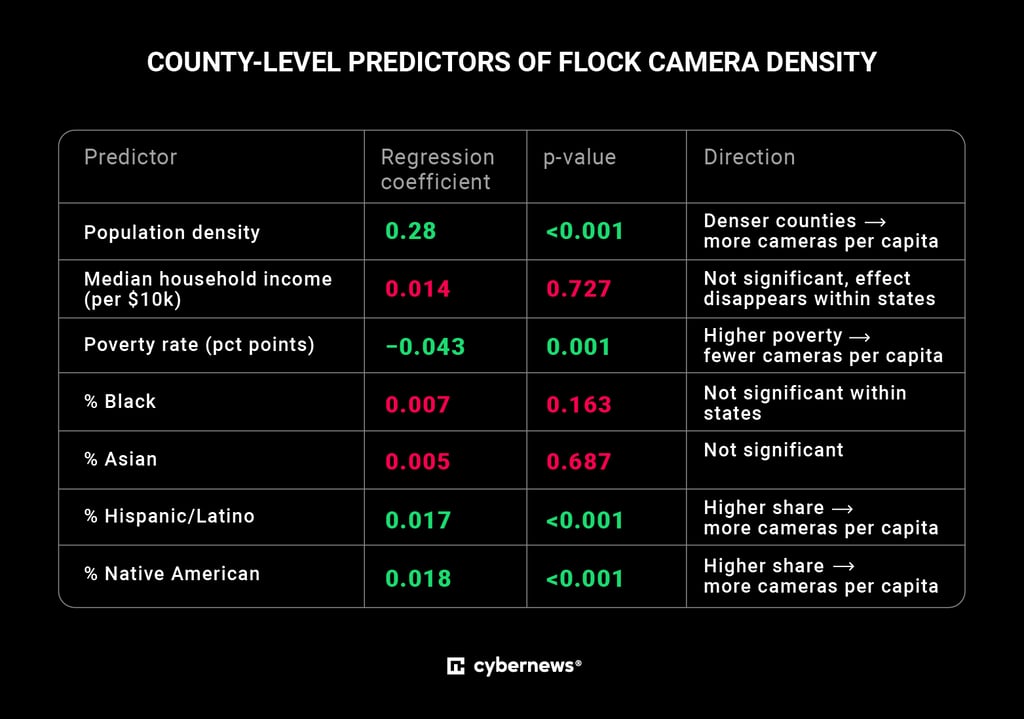
Each additional percentage point of Hispanic/Latino population share is linked to roughly a 1.7% increase in cameras per capita, and each additional point of Native American population share is linked to roughly a 1.8% increase.
There's also a statistically significant relationship between poverty levels and Flock camera density in counties. Each percentage point decrease in a county's poverty rate is associated with roughly a 4.3% increase in cameras per capita.
The analysis cannot establish why. It does not prove that these demographic and economic factors influenced camera installation.
Road networks, local funding, municipal procurement, border and transit routes, and law-enforcement priorities could all play a role.
These patterns can be a subject for further investigation, but are inconclusive in themselves.



Stay updated with our latest stories and follow us on social media
Be the first to discover new stories, ideas, and updates from our team.
The bigger question
Automated license plate readers can help locate stolen vehicles, identify wanted suspects and support investigations. But they also create an unprecedented ability to record the movement of ordinary people at scale.
With data breaches being so common, if Flock gets hacked, what are the dangers of such a wide surveillance network being exposed?
Voldemaras Kadys, Head of Security and Platform Engineering at Mediatech, the publishing house behind Cybernews, warns that:
“If a surveillance network this large was ever compromised, the consequences could be catastrophic. Foreign intelligence services could potentially use it to track the movements of government employees, see where they regularly go, who they spend time with, and so forth.
Stalkers could potentially use the system to track their victims. Burglars could use it to work out when someone leaves home and how long they tend to be away.
And, unlike a leaked password, if this information gets exposed, it’s not an easy fix. You can change your password, but you can’t change when you leave for work, which places you regularly visit, and when you’re usually away from home.
A big issue is the network’s size and the number of organizations connected to it. Flock says agencies control which other agencies can access their data, and participation in broader network sharing is optional. But thousands of law enforcement agencies are connected to the system, and some agencies share their data with large numbers of other departments. That means the attack surface isn't limited to Flock as a company itself–compromising a single agency with broad access could expose a very large surveillance network.
Moreover, if this surveillance network does get compromised, it’s possible that it wouldn’t be detected and threat actors could just use the network in secrecy.”
Methodology and limitations
| Component | Details |
| Camera locations | 131,541 camera locations from DeFlock ALPR map (OpenStreetMap). |
| Counties | Each camera was spatially joined to a US county polygon. Census TIGER county boundaries: 3,221 counties or county equivalents. |
| Demographic data | 2019–2023 ACS 5-year estimates: population, median income, poverty rate, and racial/ethnic shares. |
| Population density | County land area used to compute population density. |
| Source limitation | Camera counts depend on contributor activity. |
| General limitations | State-level correlations are not claims about individual counties or neighborhoods. Results are correlational, not causal. |