vizGPT
Last updated: 16 June 2026
What is vizGPT?
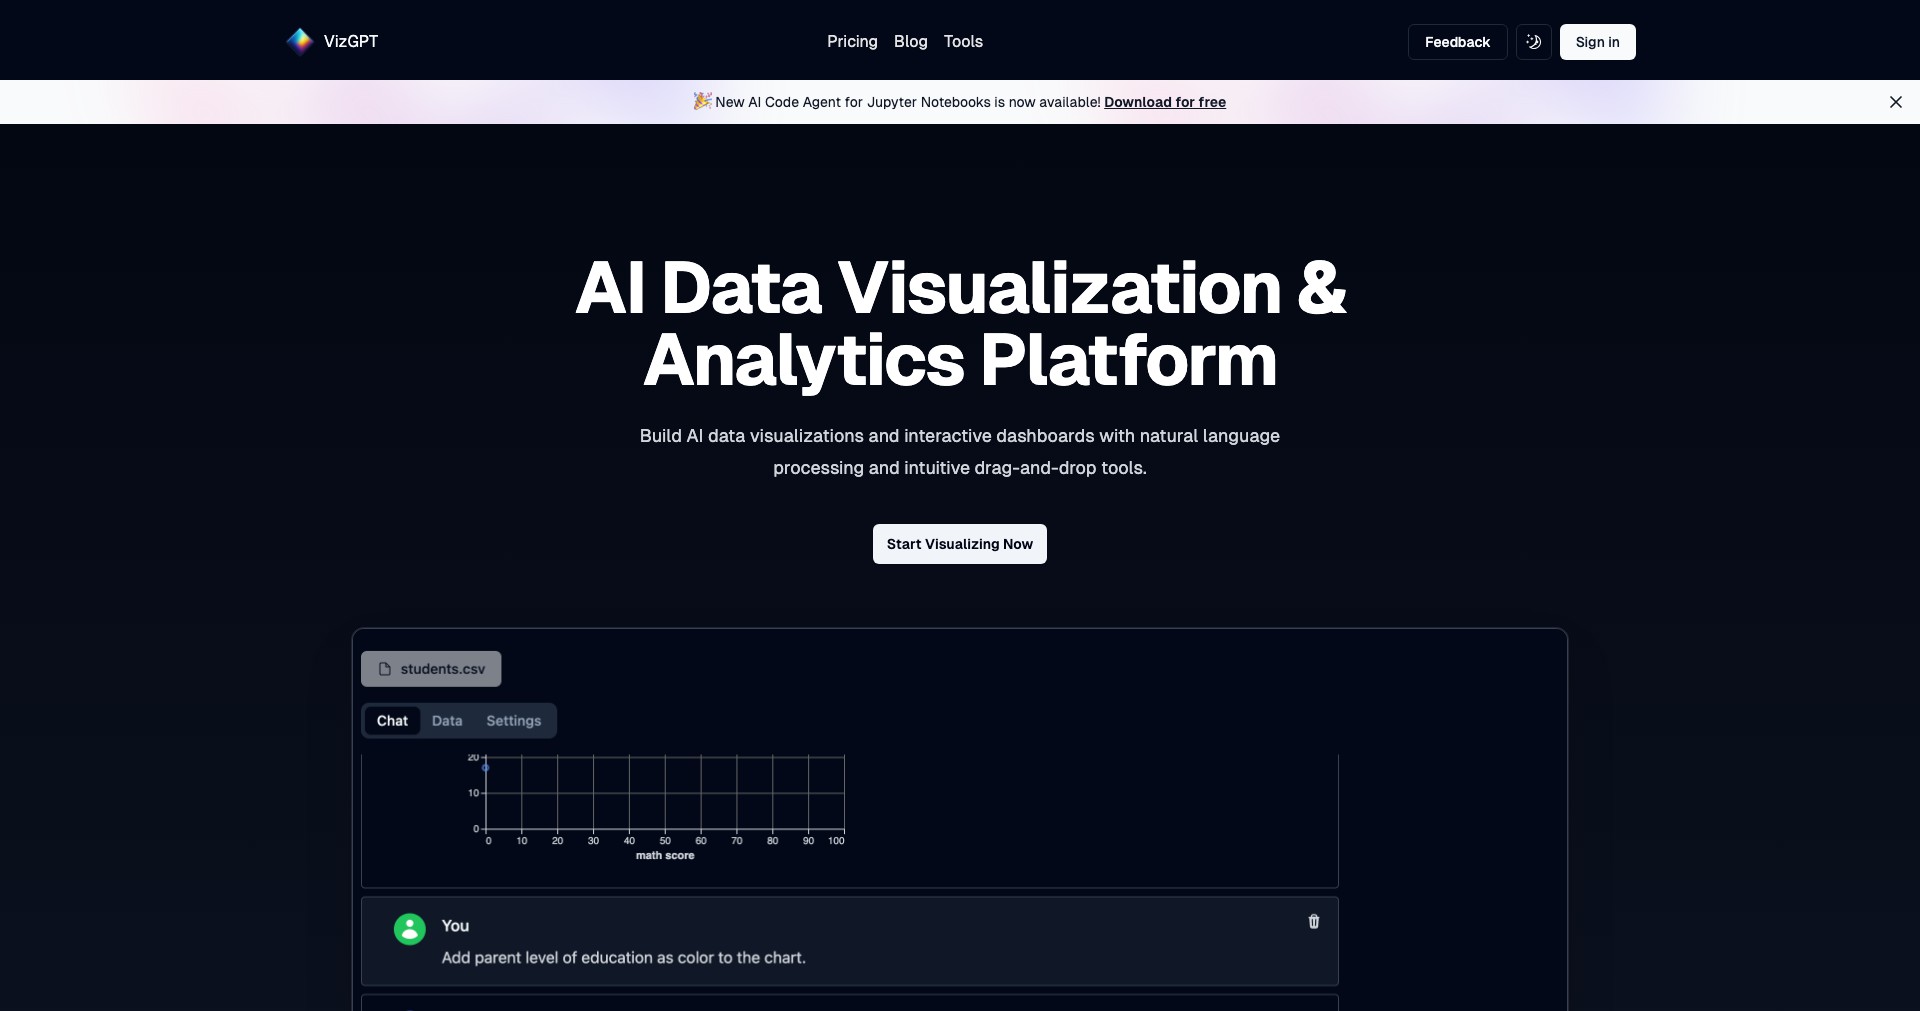
vizGPT is a next-generation data visualization assistant that leverages AI to transform written descriptions or data queries into stunning charts, graphs, and other visual formats instantly. Whether you're summarizing a data trend, sharing key performance metrics, or teaching complex concepts, vizGPT simplifies the process by allowing anyone to describe what they want to see, and then automatically generating the corresponding visualization.
This platform is ideal for professionals who need to communicate data-driven insights but lack advanced technical skills in charting software or programming. From business intelligence tasks to educational visual aids, vizGPT bridges the gap between raw data and clear visual storytelling.
Key Features:
-
Natural Language to Visualization:
Allows users to input plain text or data queries, and the AI automatically generates appropriate charts, graphs, or diagrams, saving time and lowering the skill barrier. -
Interactive Customization:
Users can adjust and refine their visualizations with simple prompts, customizing colors, labels, and chart types without needing to code or use complex interfaces. -
Embed & Export Options:
Visualizations can be downloaded in various formats or embedded into presentations, dashboards, reports, or websites, supporting seamless integration into existing workflows. -
Data Source Integration:
Supports uploads from Excel, CSV, Google Sheets, and other standard formats, enabling users to visualize data from multiple sources quickly and effortlessly. -
Collaboration Tools:
Facilitates sharing and team feedback directly within the platform, encouraging collaboration, discussion, and improved decision-making across teams.
What makes vizGPT unique?
What sets vizGPT apart is its AI-driven natural language interface, which removes the technical barriers commonly associated with business intelligence tools. Users no longer need expertise in visualization platforms or scripting; telling vizGPT what you need is almost as simple as describing it to a colleague.
Additionally, its focus on instant, interactive customization means users can iterate through different visualization styles effortlessly until they find the best fit for their data and message. This flexibility, combined with accessible collaboration tools, makes vizGPT uniquely user-friendly and efficient.
Pros and Cons
Who is using vizGPT?
Data Analysts and Business Professionals: These users benefit from faster, easier data exploration and reporting, reducing the time to insight and the need for manual chart creation.
Educators and Presenters: Teachers, trainers, and speakers can quickly generate engaging, accurate visual aids to enhance understanding and engagement in lessons or talks.
Non-Technical Stakeholders: Decision-makers and team members without data or design expertise can independently create visually appealing, comprehensible data stories.
Evolving Visualization Assistant
vizGPT started as a basic tool for generating simple charts from text-based prompts, focusing on democratizing access to data visualization.
Through user feedback, it has expanded to integrate with popular data sources, offer richer customization, and support exports in multiple formats.
Recent updates emphasize collaboration, team sharing, and improvements in AI accuracy and visual output, ensuring it remains at the forefront of user-centered data visualization.
Pricing
| Plan | Price | About |
| Free | $0 | Basic access with limited features, suitable for trying out core capabilities. |
| Pro Subscription | $20/month | Unlocks unlimited visualizations, advanced export options, and priority support. |
| Team/Enterprise | Custom | Custom pricing for organizations, enabling enhanced collaboration and integration features. |
Verdict
vizGPT excels as an intuitive tool for transforming text instructions into useful, professional-grade visualizations, especially for individuals and teams without technical backgrounds. Its natural language interface and rapid output streamline the visualization process, while broad data integration makes it a versatile addition to any workflow.
While power users may still need to refine outputs for highly complex datasets, vizGPT's ease of use, collaboration options, and affordable entry point make it a compelling choice for most business, educational, and general data visualization tasks.


