AI Adoption Index 2025: which countries use AI tools the most?
Cybernews study tracks and compares consumer AI app adoption across 64 countries based on download data of the 100 most popular AI apps.


 Follow us
This original Cybernews study examines the use of artificial intelligence tools across 64 countries to identify where AI apps are being adopted fastest and where adoption is falling behind.
Cybernews researchers analyzed download data of the 100 most popular AI apps in each country and compared those figures against national population sizes to estimate adoption rates.
AI app download data was sourced from the Google Play Store and Apple App Store via a third-party data provider.
The countries covered by our AI Adoption Index represent roughly 70% of global GDP and 55% of the world's population.
To see the full dataset, charts, and country-level breakdowns, please visit our dedicated AI Adoption Index page.






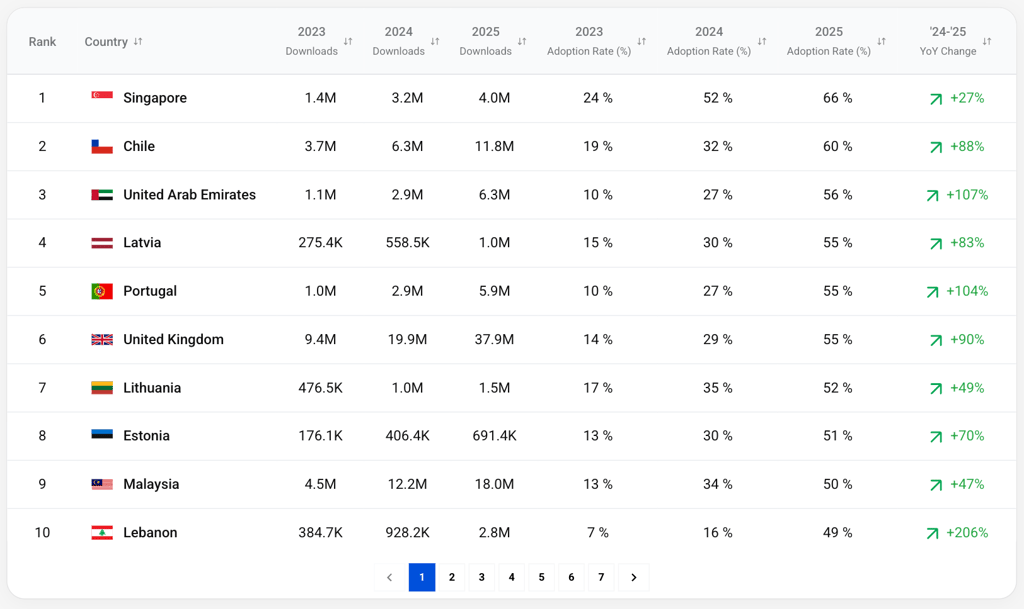
- Among the top 20 countries for AI adoption, 9 are in Europe, 7 are in Asia, 2 are in Oceania, 1 is in South America (Chile), and 1 is in North America (Canada).
- AI adoption averages 25% but varies widely, from 66% (Singapore) to 7% (Venezuela, Poland, Nigeria).
- Singapore (#1, 66%), Chile (#2, 60%), and the UAE (#3, 56%) lead global AI adoption.
- The Baltic nations, Latvia (#4, 55%), Lithuania (#7, 52%), and Estonia (#8, 51%), all rank within the top 10 for adoption.
- The United Kingdom (#6, 55%) is the AI adoption leader among Western economies.
- The United States ranks only #28 with 41% adoption despite housing most major AI companies and having the most advanced AI infrastructure.
- Japan (#57, 17%), a country known for its technological advancement, has a surprisingly low AI adoption.
Who is winning the AI adoption race?
#1 Singapore
Adoption in Singapore increased from 24% in 2023 to 52% in 2024 and 66% in 2025.
Downloads rose from 1.4 million (2023) to 3.2 million (2024) and 4.0 million (2025), with a +27% year-over-year increase from 2024 to 2025.
In 2019, Singapore was one of the first countries to introduce a National AI Strategy. This strategy included implementing AI in the education and healthcare sectors. In addition, Singapore committed more than S$500 million for AI research and development, as stated in the National AI Strategy report.
Because of these early initiatives, AI was already integrated into many public services in Singapore before the rise of ChatGPT’s popularity. AI is now being used in adaptive learning systems in schools and in health management systems in hospitals. Singapore even uses AI to support immigration and customs clearance, and to protect people against online scams.
#2 Chile
The adoption in Chile grew from 19% in 2023 to 32% in 2024 and 60% in 2025.
Downloads expanded from 3.7 million (2023) to 6.3 million (2024) and 11.8 million (2025), reflecting YoY growth of +88 % between 2024 and 2025.
The Latin American Artificial Intelligence Index (ILIA) 2025, prepared by Chile's National Center for Artificial Intelligence (CENIA), positions Chile 1st in Latin America, classifying it as a "pioneer" in AI maturity.
According to the ILIA report, Chile stands out for its balanced performance across enabling factors (infrastructure, data, and human talent), research, and governance.
#3 United Arab Emirates
In the UAE, adoption rose from 10% in 2023 to 27% in 2024 and 56% in 2025.
Downloads increased from 1.1 million (2023) to 2.9 million (2024) and 6.3 million (2025), marking +107% YoY growth.
Apart from Singapore, the only other country exhibiting a similar or even greater level of strategic AI foresight and readiness is the United Arab Emirates.
The UAE introduced the world's first National AI strategy as early as 2017. Just like in Singapore, this early initiative led the UAE to integrate AI into public services before the widespread AI boom.
In 2023, the UAE launched an updated AI roadmap for the country, the UAE Artificial Intelligence Strategy 2031, with an ambition to become a global leader in AI by 2031.
In 2025, Omar Sultan Al Olama, Minister of State for Artificial Intelligence, stated that the UAE had achieved a record 97% utilisation of artificial intelligence tools across government entities.
Baltic nations in the top 10
One of the more surprising findings from our study is that all three Baltic nations – Lithuania, Latvia, and Estonia – rank within the top 10 for AI adoption.
While not widely recognised, Baltic nations are considerably advanced in their digital infrastructures and IT workforce.
Moreover, Estonia and Latvia have the highest internet penetration rates in Central and Eastern Europe (CEE).
#4 Latvia
Adoption in Latvia advanced from 15% in 2023 to 30% in 2024 and 55% in 2025.
Downloads climbed from 275.4 thousand (2023) to 558.5 thousand (2024) and 1.0 million (2025), a +83% YoY increase.
#7 Lithuania
Adoption progressed from 17% in 2023 to 35% in 2024 and 52% in 2025.
Downloads increased from 476.5 thousand (2023) to 1.0 million (2024) and 1.5 million (2025), reflecting +49% YoY growth.
#8 Estonia
Adoption rose from 13% in 2023 to 30% in 2024 and 51% in 2025.
Downloads grew from 176.1 thousand (2023) to 406.4 thousand (2024) and 691.4 thousand (2025), marking +70% YoY growth.
US dominates in innovation and infrastructure, but not in adoption
AI tool adoption increased from 20% in 2023 to 33% in 2024 and 41% in 2025 in the US, making it rank 28th on our list.
Downloads rose from 67.4 million (2023) to 110.9 million (2024) and 139.7 million (2025), reflecting a +24% year-over-year increase from 2024 to 2025.
By sheer number of downloads, the US ranks second with almost 140 million downloads in 2025, only behind India.
Basically, while the US is a hub of AI innovation and leads in infrastructure (with 53.7 GW of installed capacity, the US accounts for 44% of global data center capacity), it is overtaken in adoption by smaller, highly digitalized, tech-savvy, and AI-ready economies.
Japan: technological leader, but trails behind in AI adoption
Despite being known for technological innovation, Japan ranks #57 out of 64 countries with just 17% AI adoption. With 21.3 million downloads in 2025, interest in AI tools exists, but per-capita adoption suggests something is hindering their penetration into the market.
Several factors likely contribute. First, Japan's corporate culture has a consensus-driven decision-making (nemawashi), which can significantly slow the adoption of transformative technologies like AI in businesses. Japan also has the oldest population in the world — 28.7% of its population is 65 or older.
Moreover, under the Stabilization of Employment of Elderly Persons Law, companies in Japan are required to secure employment up to age 65 and are encouraged to make efforts to provide job opportunities up to age 70.
What this amounts to, possibly, is that younger employees who might champion AI adoption represent a smaller proportion of the workforce, and elderly employees, who are not as keen on adopting new technologies and disrupting already established processes, are mostly responsible for decision-making, so AI tool adoption in businesses is slower compared to many other countries.
The language barrier can also play a significant role. Most leading AI tools, particularly large language models, were primarily trained on English-language data and optimized for English-speaking users. Japan ranks in the "very low proficiency" band for English, placing 96th out of 123 countries in the 2025 EF English Proficiency Index.
In the end, the oldest population globally, low English language proficiency, and difficulty in implementing AI tools into companies due to long-standing practices are probably some of the main reasons behind this relatively low adoption of AI tools in Japan.
The Philippines experienced a unique drop in adoption
In a dataset where every country shows positive year-over-year growth, the Philippines is the only country where AI adoption actually declined. Downloads dropped from 43.4 million in 2024 to 40.8 million in 2025, a 5% decrease, while adoption fell from 37% to 35%, placing the country 47th in our rankings.
The Philippines had been an early adopter relative to its economic peers, with an English-speaking population that embraced AI tools enthusiastically. Unfortunately, the Philippines saw its economy slow considerably in 2025, posting 4.4% GDP growth, the weakest since 2011 outside the 2020 pandemic, which is likely one of, if not the main contributing factor to the decrease in adoption.
Bottom performers
These are the ten lowest-ranked countries by AI adoption in our index:
| Rank | Country | 2024 Adoption | 2025 Adoption | YoY Growth |
| #55 | Thailand | 10% | 23% | 130% |
| #56 | Egypt | 9% | 18% | 100% |
| #57 | Japan | 6% | 17% | 183% |
| #58 | South Africa | 8% | 16% | 100% |
| #59 | Belarus | 7% | 12% | 71% |
| #60 | Pakistan | 3% | 12% | 300% |
| #61 | India | 3% | 11% | 267% |
| #62 | Nigeria | 1% | 7% | 600% |
| #63 | Poland | 3% | 7% | 133% |
| #64 | Venezuela | 3% | 7% | 133% |
Explosive or not-so-explosive growth
Year-over-year growth rates show where AI adoption is accelerating fastest. Five countries achieved growth exceeding 200%:
| Country | 2024 Adoption | 2025 Adoption | YoY Growth | Current Rank |
| Nigeria | 1% | 7% | 600% | #62 |
| Pakistan | 3% | 12% | 300% | #60 |
| India | 3% | 11% | 267% | #61 |
| Algeria | 11% | 37% | 236% | #33 |
| Lebanon | 16% | 49% | 206% | #10 |
These percentages, though high, should be viewed in context: growth from 1% to 7% in Nigeria registers as 600% growth YoY, but represents only a 6% absolute gain, leaving the country still third from last globally in AI adoption.
Download volume vs. adoption
Top five countries by raw download volume (2025):
| Rank by Volume | Country | Total Downloads | Adoption Rate | Adoption Rank |
| 1 | India | 162.5M | 11% | #61 |
| 2 | United States | 139.7M | 41% | #28 |
| 3 | Brazil | 74.6M | 35% | #43 |
| 4 | Indonesia | 70.4M | 25% | #53 |
| 5 | Mexico | 53.1M | 40% | #29 |
There’s a huge difference between countries that have the highest download volumes and those that have the highest penetration rates. India's 162.5 million downloads dwarf Singapore's 3.9 million by a factor of 40, yet Singapore's adoption rate is six times higher.
The United States, despite generating the second-highest download volume globally, ranks only #28 in adoption.
Countries with high download volume but low adoption rates, like India, Indonesia, and Brazil, have significant room for growth as infrastructure improves and AI tools become more accessible to broader populations.
Meanwhile, high-adoption countries like Singapore, Chile, and the UAE have already achieved deep penetration and will see future growth slow as they approach saturation.
GDP per capita correlates with adoption, somewhat
There’s a relationship between GDP per capita and consumer AI adoption, to some extent. Wealthier countries generally adopt earlier, but GDP per capita functions more as a threshold.
In our dataset, the top 10 adopting countries average roughly 55% consumer adoption with an average GDP per capita of $42,327, while the bottom 10 average about 13% adoption with an average GDP per capita of $11,428.
At very low income levels, adoption is frequently capped by fundamentals such as electricity access and internet penetration. For example, in Nigeria, one of the lowest adopters, only around 60% of the population has access to electricity.
However, once countries reach a level of development where connectivity and access are broadly available, the relationship between GDP and adoption becomes substantially weaker. At that point, differences in adoption are likely better explained by digital literacy, language, demographic structure (especially age), regulatory climate, and how strongly workplaces normalize AI use.
Conclusion
Based on app download data across 64 countries representing 70% of global GDP, our research found that adoption is highest in small, digitally advanced, agile nations with early national AI strategies, led by Singapore (66%), Chile (60%), and the UAE (56%).
The Baltic states, while small, have a strong digital infrastructure, high English proficiency, and a tech-savvy population, likely allowing them to adopt new technologies more quickly than large populations.
Explosive growth markets like Nigeria (600% YoY), Pakistan (300%), and India (267%) show growing demand but remain constrained by infrastructure barriers.
In countries with low economic development, fundamentals like electricity, devices, and internet access tend to limit adoption. However, once countries reach a certain level of development where connectivity is broadly available, GDP per capita becomes a weak predictor of AI use. At that point, differences in adoption are better explained by factors such as digital literacy, language, demographics (especially age), regulation, and how strongly workplaces and institutions normalize day-to-day AI use.
See the complete AI Adoption Index dataset.
Methodology
Our research team used Worldometers.info and the United Nations statistics to determine countries' annual population from 2023 to 2025. It was then compared to Google Play Store and Apple App Store download volumes for the 100 most popular AI apps. Population and AI app download metrics were then contrasted to calculate annual AI adoption rates.
Limitations
- The dataset is exclusively composed of download statistics from the Google Play Store and Apple App Store. This scope inherently excludes other significant distribution channels, such as desktop-based software installations, side-loaded Android application packages (APKs), browser tools, and direct downloads from provider websites.
- The primary metric is the number of download events, which may not directly equate to the number of unique users. A single user may contribute multiple downloads through device changes, reinstallations, or updates, potentially inflating adoption estimates. As such, the data reflects the volume of download activity rather than the size of the active user base.
- Geographic data is based on the user's app store region setting, which may not correspond to their physical location. This discrepancy is particularly noteworthy in regions with internet restrictions, where users may register their accounts in foreign countries to circumvent censorship.
- Adoption rates are derived by normalizing downloads against the total population of each country. This method does not control country-specific variables that influence technology adoption, such as internet penetration rates, smartphone ownership, or demographic distributions. Therefore, direct comparisons of per capita adoption rates between countries with different technological infrastructures should be made with caution.
- The study's sample is limited to 100 pre-selected AI apps. This introduces a potential selection bias, as the dataset does not account for downloads from smaller, niche, or region-specific providers that constitute a portion of the overall market.
- One major global player missing from the study is China. However, Google Play Store is blocked in China, and Apple's App Store accounts for only around 20% of China's app market. Given these constraints, China was excluded from the study.